
In quantitative double‑antibody sandwich ELISA systems, the hook effect (high‑dose hook effect, prozone phenomenon) is a deceptive analytical interference. It does not stem from operational errors or kit defects, but represents an intrinsic immune reaction feature caused by stoichiometric imbalance between antigen and antibody. Serial sample dilution pre‑experiment is currently the most direct and universal laboratory method to identify, verify and avoid the hook effect. Essentially, the relationship between them reflects the causal link between “quantitative pitfalls brought by immune‑binding rules” and “methodological quality control via dilution linearity testing”. This applies across full ELISA scenarios including biomarker measurement, pharmacokinetics and clinical sample screening.
The quantitative basis of sandwich ELISA relies on formation of a ternary sandwich complex: solid‑phase capture antibody‑antigen‑enzyme‑labeled detection antibody. Capture antibodies are coated onto the solid phase and recognize one epitope of the antigen; enzyme‑conjugated detection antibodies bind a separate, independent epitope. A detectable chromogenic sandwich structure forms only when both antibodies bind to the same antigen molecule. Within the kit’s linear range, OD values correlate positively with antigen concentration.
As antigen concentration rises, signals increase steadily within the quantitative linear range. Once antigen concentration exceeds the upper detection limit, antigen excess occurs: antigen molecules vastly outnumber available binding sites on capture and detection antibodies. Numerous antigen molecules bind either capture antibodies or enzyme‑labeled antibodies individually. Antigens act like a barrier separating the two antibody populations and prevent assembly of sandwich complexes. Further increasing antigen concentration reduces the number of detectable sandwich complexes. The OD curve peaks then bends downward, forming a hook‑shaped profile, hence the name hook effect.
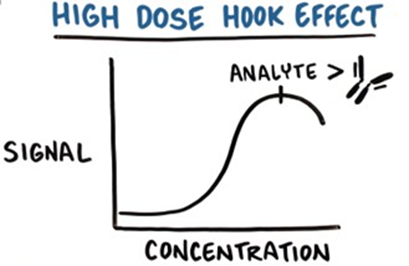
Schematic: High‑Dose Hook‑Effect Curve
Two key boundaries should be clarified. First, the hook effect primarily occurs in double‑antibody sandwich ELISA; competitive ELISA uses limited antibody with antigen competition and does not produce this artifact. Second, hook effect is distinct from signal saturation. Saturation produces stable plateau OD values with increasing antigen; hook effect causes decreasing OD at higher antigen concentrations, leading to false‑negative results and severe underestimation of sample concentrations. This hidden risk frequently appears in samples with wide target‑analyte concentration spans such as cytokines, chemokines, drug concentrations, viral antigens, urine and tissue homogenates.
From the standard‑curve perspective: the kit‑specified linear range is method‑validated for stable sandwich‑complex formation. Concentrations above the upper limit fall into two zones: saturation plateau and hook‑effect descending zone. Standard curves alone cannot distinguish samples falling in the plateau versus hook‑effect region. Testing undiluted neat samples cannot identify this pitfall, which explains the irreplaceable value of dilution pre‑experiments.
The core metric for dilution pre‑experiment is dilution parallelism / dilution linearity. Under ideal conditions, back‑calculated concentrations from serially diluted samples within the valid quantitative range should remain consistent with acceptable CV values. For samples inside the hook‑effect zone, dilution lowers absolute antigen concentration, relieves antigen excess, restores abundant sandwich‑complex formation and elevates OD readings. Back‑calculated concentrations become markedly higher than neat‑sample results. “Back‑calculated diluted concentration > neat‑sample concentration” serves as the signature criterion for hook effect.
Two typical outcome patterns are compared below:
Dilution pre‑experiments fulfil two quality‑control tasks: identifying matrix effects and non‑specific interferences, and screening for hook effect. Matrix effects generally produce globally shifted yet consistent trends across dilutions; hook effect yields inverse trends. These two phenomena can be differentiated from pre‑experiment data, and poor dilution linearity cannot be simply attributed to hook effect alone.
Kit‑labeled linear ranges are established using recombinant standards. Clinical samples, in‑vivo dosed specimens and tissue lysates feature complex matrices and highly heterogeneous endogenous analyte levels. Antigen concentrations in some samples may exceed the upper standard‑curve limit by tens‑ to thousand‑fold. Researchers cannot predict hook effect merely from sample origin. Examples include abundant pro‑inflammatory cytokines in inflammatory‑model serum, peak pharmacokinetic monoclonal‑antibody concentrations, and soluble receptors in proteinuric samples, which readily surpass detection limits. Testing only neat samples yielding low OD may lead investigators to incorrectly assign low expression, generating completely erroneous data and opposite biological conclusions. Owing to hook‑effect concealment, dilution pre‑experiment constitutes a mandatory upfront procedure for high‑abundance analytes rather than a remedial measure after assay failure.
Gradients must be rationally designed to cover broad concentration windows ensuring at least one dilution falls inside the standard‑curve linear range. Common pre‑experiment gradient combinations: neat, 1:10, 1:100, 1:1000. Two‑fold or five‑fold fine gradients may be deployed according to expected analyte concentrations.
- Excessively large gradient intervals risk skipping the hook‑effect inflection point and causing linearity misjudgment;
- Too few gradients (neat plus a single diluted tube) cannot distinguish saturation, hook effect and matrix interference;
- Dilutions must use kit‑supplied sample diluent; serial dilution minimizes pipetting error. Diluent itself must not introduce new matrix artifacts that confound hook‑effect interpretation.
Practical interpretation guideline: hook effect is confirmed when back‑calculated concentration from one dilution exceeds neat‑sample readings by more than two‑fold and values stabilize upon further dilution. Subsequent formal assays adopt the dilution factor corresponding to this stable linear window. Only results within stable dilution‑parallel intervals are reported; neat‑sample data are discarded and excluded from statistics.
Dilution serves as a sample pre‑processing workaround without modifying intrinsic kit parameters such as antibody pairing, coating density or enzyme‑antibody working concentrations, and therefore does not change the critical concentration triggering hook effect for that kit. For extremely high‑antigen samples that remain within the hook‑effect zone even after 1:1000 dilution, unlimited dilution introduces new complications: analytes may drop near assay lower limits with reduced signal‑to‑noise ratio and poor precision; extreme dilution also alters matrix composition and invalidates dilution parallelism. In such cases, dilution pre‑experiment indicates insufficient kit dynamic range. Alternative solutions include wide‑dynamic‑range kits, two‑step incubation protocols or alternative detection platforms instead of endless sample dilution.
Hook effect represents an inherent limitation of double‑antibody‑sandwich ELISA immunoassays. Severe antigen excess inhibits sandwich‑complex assembly, abnormally lowers signals and produces false‑negative outputs. Sample dilution pre‑experiment is a quality‑control strategy that modifies absolute antigen concentrations and tests dilution parallelism to identify hook‑effect inflection points and select appropriate assay dilution factors. To summarize: hook effect constitutes one major driving rationale for dilution pre‑experiments, and dilution pre‑experiment acts as the core laboratory tool to detect and mitigate hook effect.
Reliable quantitative ELISA cannot rely on “hit‑or‑miss” single‑tube neat‑sample testing. For analytes with large abundance fluctuations, serial dilution pre‑experiment should be incorporated into standard workflows. Select appropriate dilution factors according to dilution‑parallelism results to judge whether samples fall within hook‑effect zones. This ensures authentic data and prevents misleading biological conclusions originating from immune‑reaction stoichiometric imbalance.